Measure successful paths and time taken.
FREE TOOLS Kubera indicators for TradingView →
FREE · NSE-FOCUSED · END-OF-DAY
Find the stocks worth checking next.
KuberaXLeap turns delivery activity, price trend and historical outcomes into a short, visual list of NSE swing-trade candidates—with plain-language reasons for every next step.
✓ Free to use✓ Updated after NSE EOD✓ No buy/sell tips

01Shortlist
Reduce a large market to a manageable watchlist.
02Understand
See why each candidate deserves attention.
03Plan
Start with clear entry, stop and target references.
A PRACTICAL DAILY WORKFLOW
From 1,000+ stocks to a few charts.
You do not need to decode dozens of technical columns. Start with the action, then open the evidence only when you need it.
Step 1
Choose what deserves your time
The shortlist combines buying interest, trend support and trade-plan signals. Plain-language labels tell you whether to inspect the chart, wait for confirmation or leave it alone.
- Filter by price, risk and signal strength
- Separate early buying from trend-confirmed candidates
- Keep the detailed calculations hidden by default

Step 2
Understand the candidate at a glance.
A compact visual profile shows whether the evidence is balanced or driven by one isolated spike. Delivery, activity, trend support and participation are translated into readable signals.
What is happening?
Buying building, heavy activity, weakening or no clear edge.
Is the evidence balanced?
Compare the shape instead of trusting one headline score.
Is it extended?
Inspect the chart before acting on any shortlist.
VISUAL COMPARISON
See where buying and trend agree.
The upper-right area is the most interesting: stronger buying activity and stronger trend support appear together. Bubble size adds a liquidity cue.

Step 3
Turn an idea into a risk-aware plan.
Trade Plans groups candidates by what the signal means and supplies starting reference levels for entry, stop and target. The app remains end-of-day decision support—not an execution signal.
- Ready to inspect: buying signals aligned
- Heavy activity: confirm the direction first
- Watch: wait for stronger confirmation

HISTORICAL CONTEXT
Ask what happened next—not only what happened today.
Signals are checked against past occurrences. KuberaXLeap records whether a target or stop was reached first, how many sessions it took, and how price behaved afterwards.
Why this matters
A pattern that looks convincing today is more useful when you can also see its historical frequency and follow-through. Past outcomes improve context; they never guarantee the next trade.
Learn what should be filtered more carefully.
Avoid forcing every historical case into a winner or loser.
FREE TRADINGVIEW INDICATORS
Take Kubera onto your charts.
Two community indicators add fundamental and technical context inside TradingView. Both are free; their access methods are different.
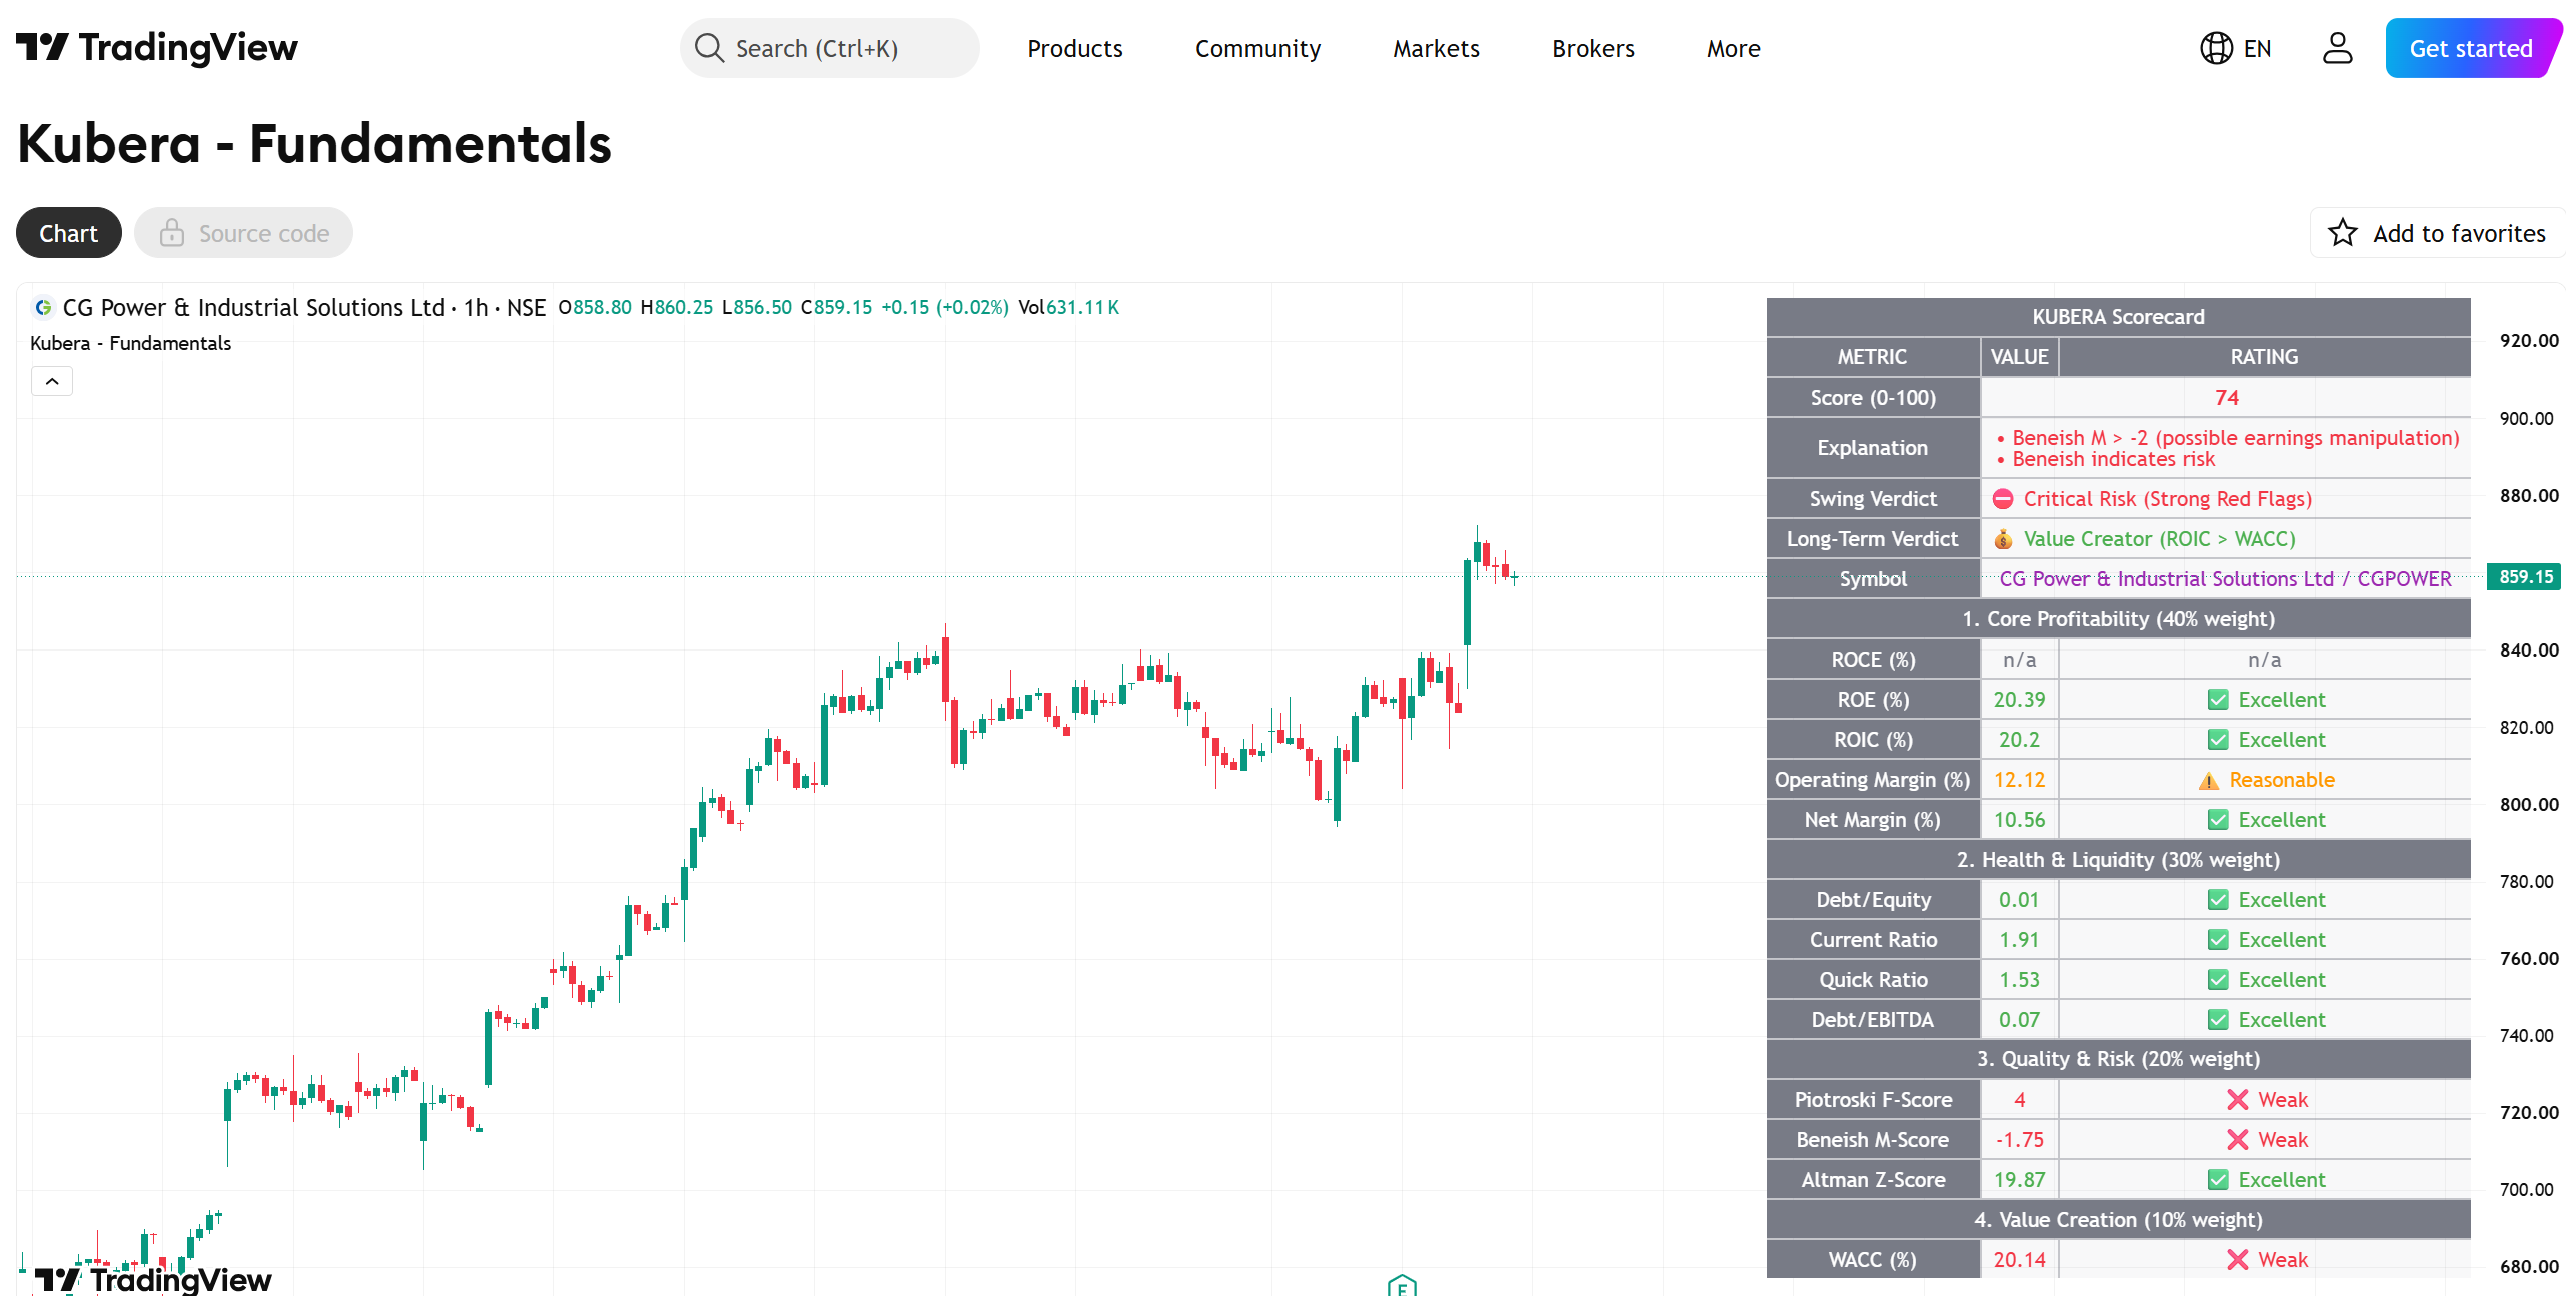
Kubera – Fundamentals
Brings nine core business-quality and financial-risk measures into one visual scorecard, including profitability, efficiency, margins and debt.
No access form is required. Open the indicator page and use it on your TradingView chart.
Use on TradingView ↗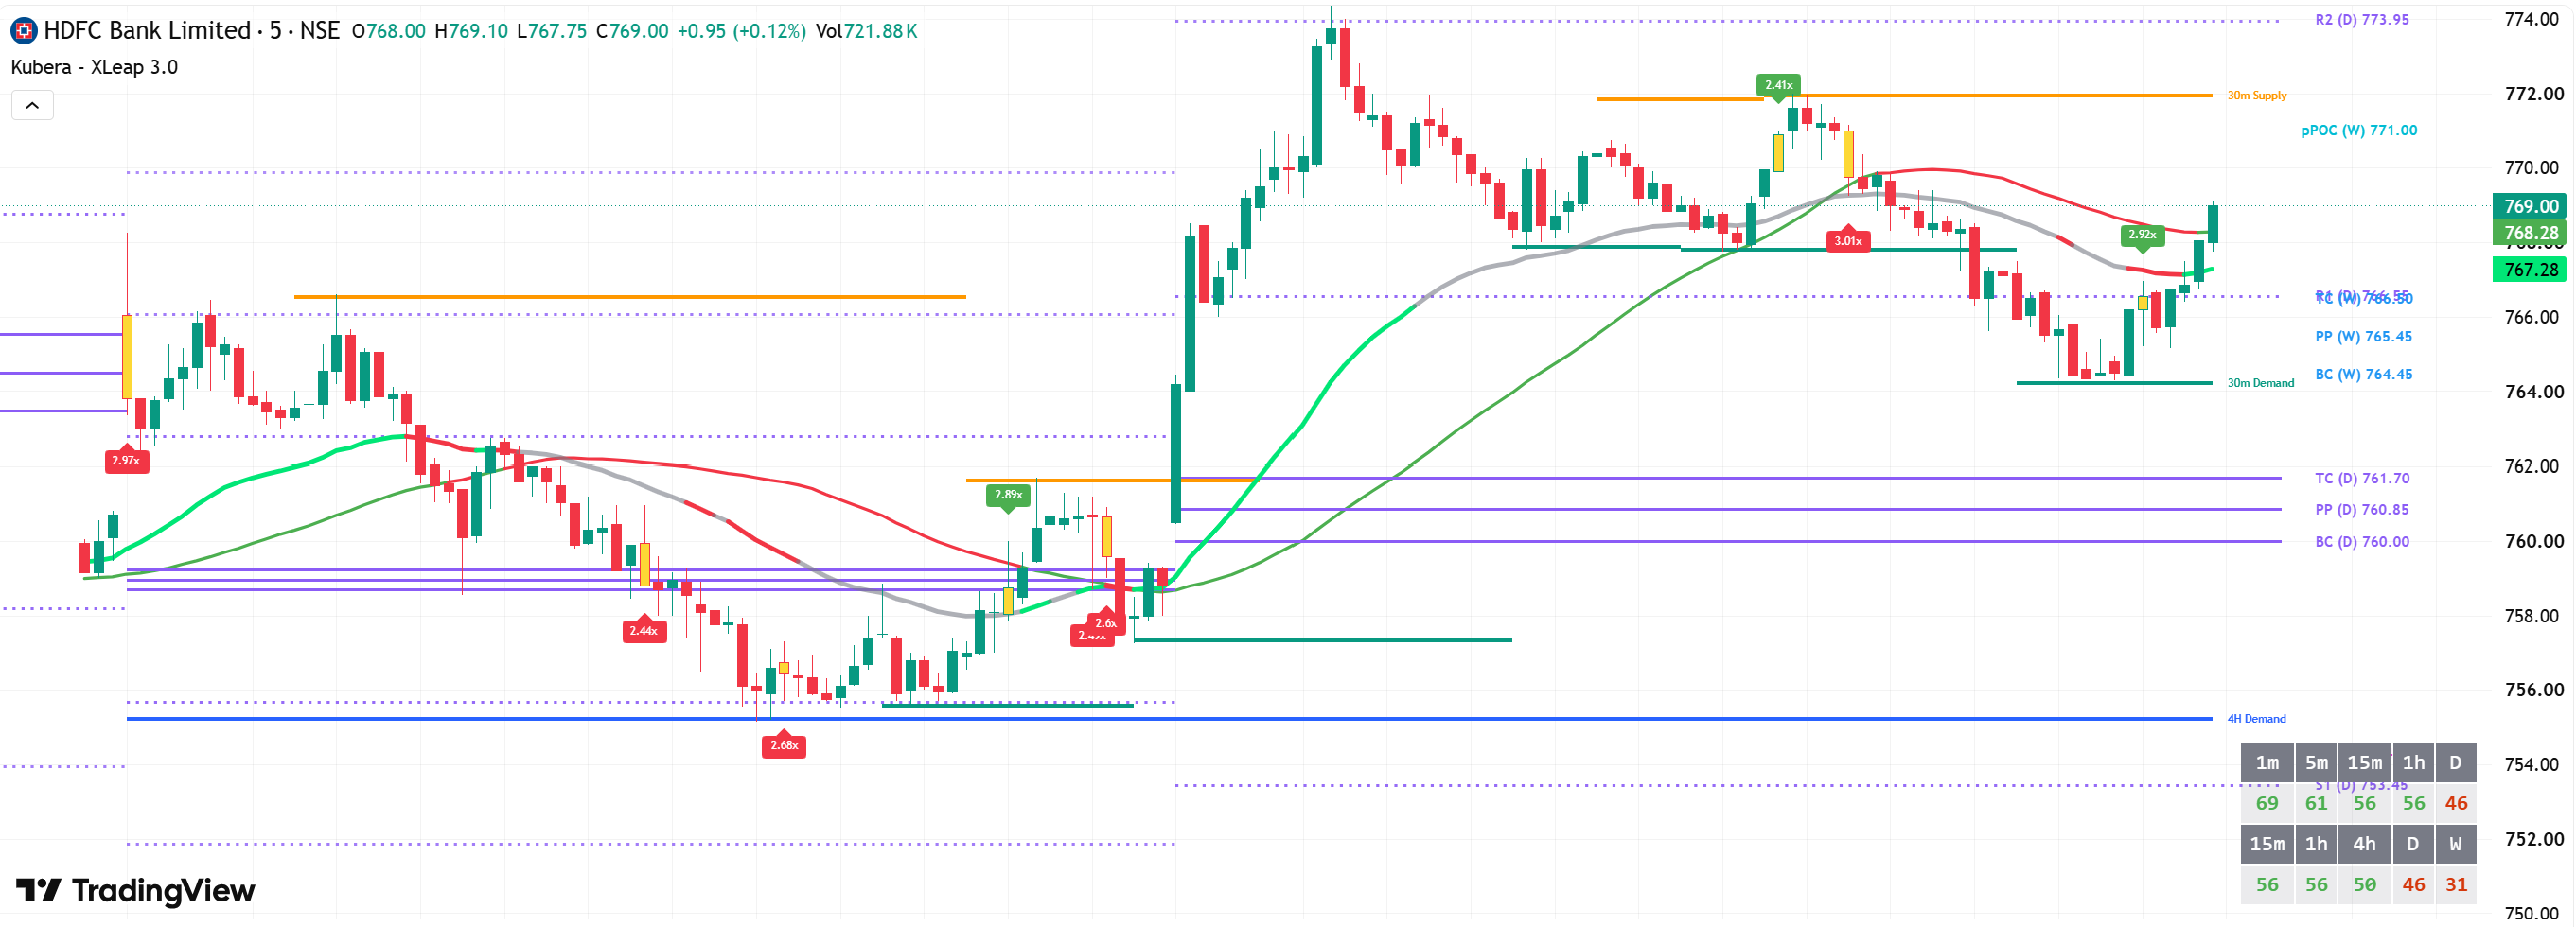
Kubera – XLeap
A visual technical-analysis workspace combining trend, levels, momentum, volume context and multi-timeframe cues directly on the chart.
How to get access: read and accept the disclaimer, then provide only your correct TradingView username. Approval may take 72 hours or more.
These TradingView indicators are educational tools, not financial advice or performance guarantees. Kubera – XLeap access is granted using a TradingView username—not an email address or phone number.
MADE FOR REAL PEOPLE
Useful without becoming a trading terminal.
Plain language first.
Technical detail is available, but it does not stand between the user and the decision.
Visual evidence.
Charts reveal relationships that are hard to find in a dense table.
Honest boundaries.
The site helps users research candidates; it does not tell anyone what to buy.
TODAY’S NSE SHORTLIST
Know what to inspect before you open another chart.
Free for the community. Sign in with Google to open the finder.